
Retail Trade trend estimate decreased by 0.0 per cent in March 2024 and increased 1.1 per cent year-on-year
The latest release (March 2024) of the monthly ABS Retail Trade data indicates that the overall month-on-month (m-o-m) trend estimate decreased by 0.0 per cent, equal to (a revised) 0.0 per cent in February 2024. In trend terms, Retail Turnover increased by 1.1 per cent year-on-year (y-o-y), down from (a revised) 1.2 per cent in the pcp.
STATE OF PLAY
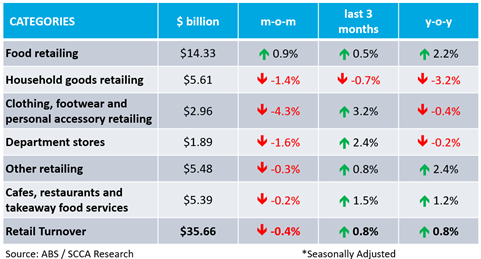
The following table summarises the key data in seasonally adjusted terms across the six ABS retail categories. The strongest growth was recorded for ‘Food’ retailing on a m-o-m basis (up 0.9 per cent), whilst ‘Other’ retailing was the strongest category on a y-o-y basis (up 2.4 per cent). In seasonally adjusted terms, Retail Turnover decreased by 0.4 per cent in the month of March 2024, down from (a revised) 0.2 per cent in the prior month. On a y-o-y basis, Retail Turnover increased by 0.8 per cent, down from (a revised) 1.5 per cent in the pcp.
TREND ANALYSIS: CHAIN VOLUME MEASURES
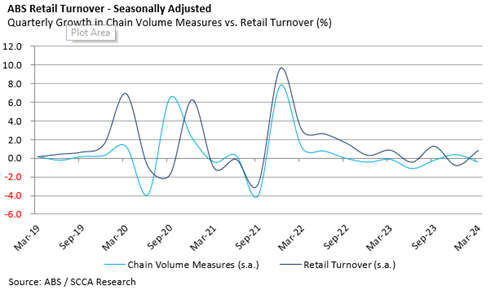
The quarterly chain volume measure estimates the change in value after the direct effects of price changes have been eliminated, reflecting changes in volume. In the March 2024 quarter, Chain Volume Measures decreased by 0.4 per cent, down from (a revised) increase of 0.4 per cent decrease in the pcp. Retail Turnover increased by 0.8 per cent in the March 2024 quarter, up from a (revised) -0.8 per cent in the pcp. Chain Volume Measures is once again below Retail Turnover, indicating that price inflation is a significant contributor to turnover.
STATE BY STATE: BEST AND WORST
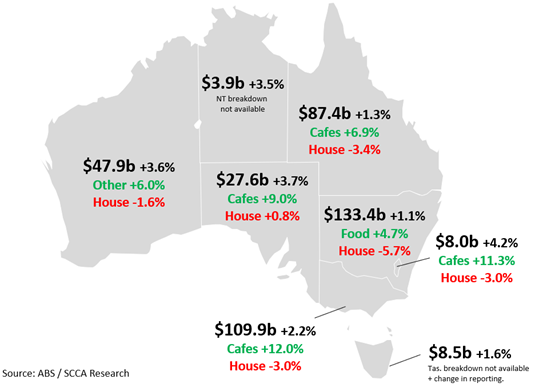
Retail Turnover varies within the ABS defined six categories and across different jurisdictions. The following map outlines and compares the total and growth of retail trade over the last 12-months (vs. the pcp), and the best and worst retail growth categories.
The strongest jurisdictions in seasonally adjusted terms were the ACT (up 4.2 per cent to $8.0 billion) followed by South Australia (up 3.7 per cent to $27.6 billion) and Western Australia (up 3.6 per cent to $47.9 billion). New South Wales (up 1.1 per cent to $133.4 billion) was the worst performing jurisdiction in percentage terms. The highest growth across most jurisdictions was recorded for ‘Cafes, restaurants and takeaway food’ retailing, whilst the weakest category across all jurisdictions was ‘Household goods’ retailing. South Australia was the only jurisdiction to record positive growth across all six categories.
Research note source from Shopping Centre Council of Australia.